

Interactive Infographic Prototype for Web Applications
Category:
Infographics
File format:
Figma/Adobe XD File, GIF Demo, HTML/CSS/JS
Style:
Interactive
Delivery time:
3–5 days
Revisions:
1
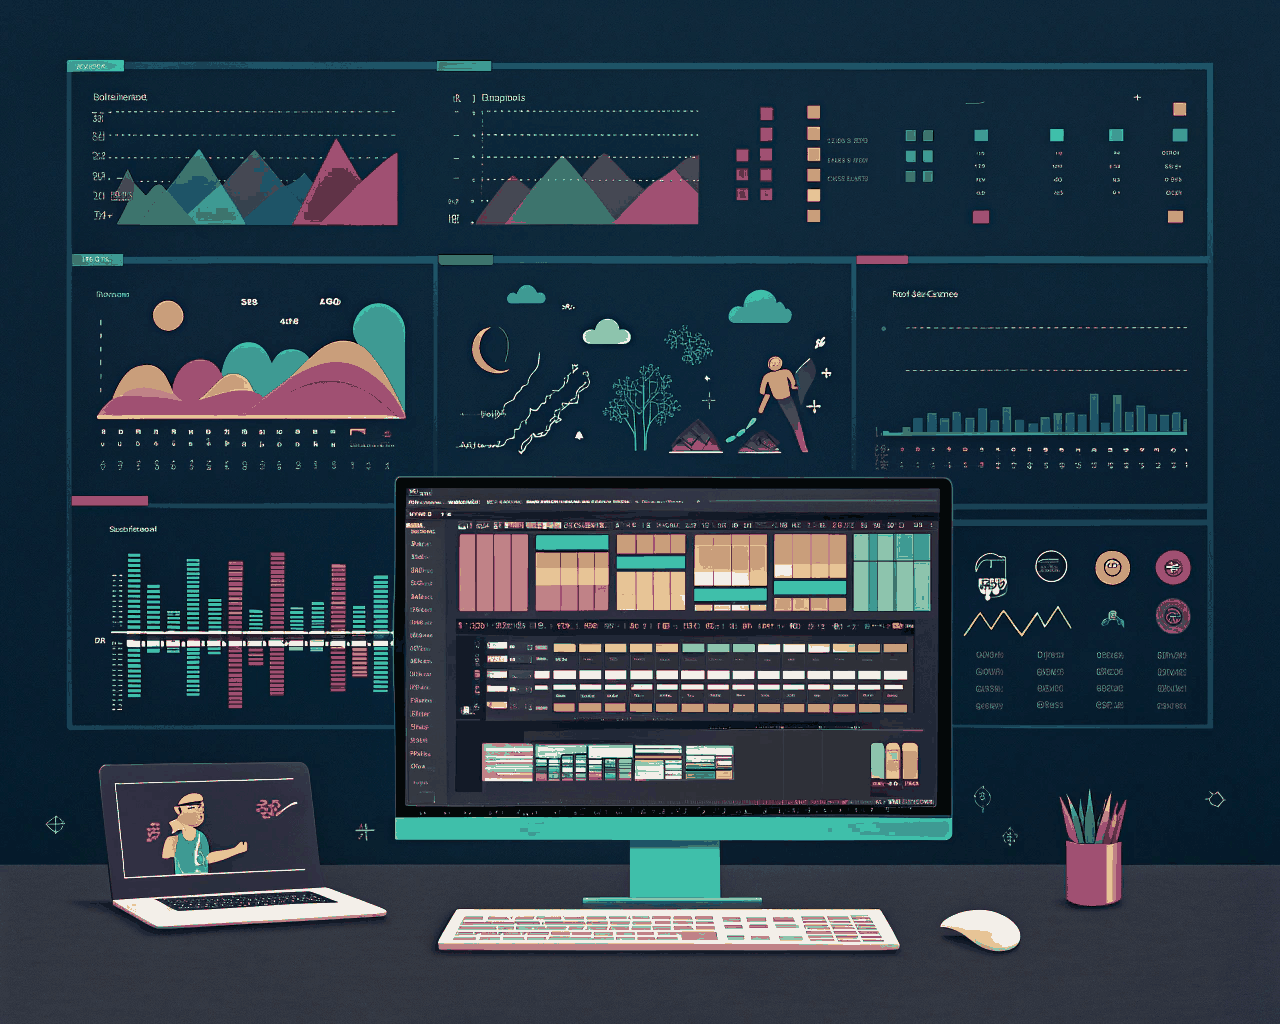
Transforming intricate data into an engaging feature that resonates with users is made possible through an interactive infographic prototype for your web application or landing page. This approach offers a clickable, responsive data experience that captivates users far more effectively than a static image.
The outcome is a prototype ready for development, specifically designed for seamless integration into your existing system. The process begins with creating a mockup in Figma or Adobe XD, which highlights all the visual states. Following this, I build a lightweight, responsive front-end prototype utilizing HTML, CSS, and vanilla JavaScript. While this does not encompass a complete backend integration, it results in a clean, well-documented front-end component that your development team can effortlessly incorporate into your system. Included in the package are the full design system file with all necessary assets, the source code with comments, a demo GIF illustrating the interactions, and a guide on how to link it to your data API.
In today’s digital landscape, web applications must convey intricate data in an easily digestible format. This is where an interactive infographic prototype becomes invaluable. I draw inspiration from successful, minimalist interactions found on platforms like Our World in Data or Bloomberg Graphics, where every animation and transition serves a specific purpose, guiding users toward insights without overwhelming them. This tool is practical for making data a central feature of your product.
For instance, consultants and coaches in the fintech sector can utilize an interactive infographic to showcase investment strategies or market trends effectively. Similarly, digital publications can develop captivating data visualizations that enhance user engagement and improve information retention. Whether you represent a SaaS company or a platform displaying user-facing data, an interactive infographic prototype serves as an excellent method for presenting complex information in an understandable and engaging manner.
€150.00
Comments
Discover the similar products

Infographics
Annual Report Data Visualization for Finance Teams
Infographics


Infographics
Interactive Infographic Prototype for Web Deployment
Infographics


Transforming intricate data into an engaging feature that resonates with users is made possible through an interactive infographic prototype for your web application or landing page. This approach offers a clickable, responsive data experience that captivates users far more effectively than a static image.
The outcome is a prototype ready for development, specifically designed for seamless integration into your existing system. The process begins with creating a mockup in Figma or Adobe XD, which highlights all the visual states. Following this, I build a lightweight, responsive front-end prototype utilizing HTML, CSS, and vanilla JavaScript. While this does not encompass a complete backend integration, it results in a clean, well-documented front-end component that your development team can effortlessly incorporate into your system. Included in the package are the full design system file with all necessary assets, the source code with comments, a demo GIF illustrating the interactions, and a guide on how to link it to your data API.
In today’s digital landscape, web applications must convey intricate data in an easily digestible format. This is where an interactive infographic prototype becomes invaluable. I draw inspiration from successful, minimalist interactions found on platforms like Our World in Data or Bloomberg Graphics, where every animation and transition serves a specific purpose, guiding users toward insights without overwhelming them. This tool is practical for making data a central feature of your product.
For instance, consultants and coaches in the fintech sector can utilize an interactive infographic to showcase investment strategies or market trends effectively. Similarly, digital publications can develop captivating data visualizations that enhance user engagement and improve information retention. Whether you represent a SaaS company or a platform displaying user-facing data, an interactive infographic prototype serves as an excellent method for presenting complex information in an understandable and engaging manner.