
Icon & Vector Design
Custom App Icon Suite for Fintech and SaaS Platforms
Icon & Vector Design
Isometric Vector Illustrations for Tech SaaS Dashboard Elements
Category:
File format:
Style:
Delivery time:
Revisions:
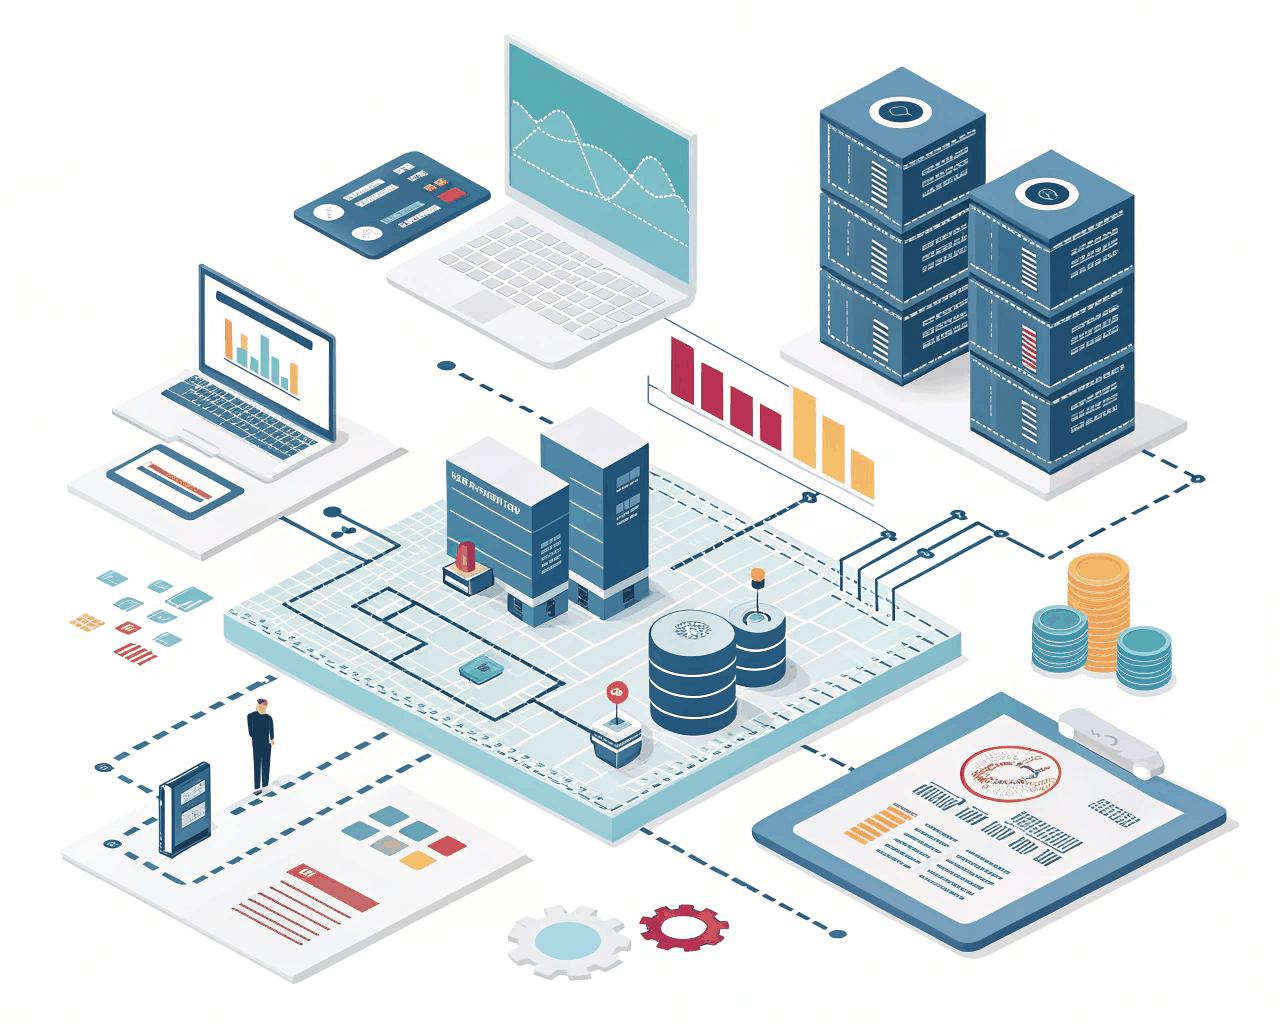
A well-defined brand identity simplifies intricate tech ideas, making them more relatable and memorable. Isometric vector illustrations effectively showcase SaaS features, offering a clear visual representation of technical elements that users can easily grasp. In the context of a SaaS dashboard, tailored isometric illustrations depicting items such as servers, data clouds, and analytics graphs can clarify complex data flows and operations.
You will receive a set of three distinct isometric scene illustrations, each featuring various interconnected objects. For instance, a visual representation of a data pipeline leading into a report can effectively demonstrate the relationship between data collection and storage. These illustrations are specifically designed to reflect your product’s interface or data flow, ensuring they are accurate and pertinent.
With considerable experience in producing materials for B2B software firms, I have observed that isometric illustrations significantly enhance the communication of capabilities, whether in onboarding guides, sales presentations, or product tutorials. The use of an isometric grid guarantees that all components maintain a consistent perspective and lighting, resulting in a polished and unified set rather than a haphazard assortment of images.
The files are provided as fully editable AI vectors, with each component organized on separate layers, allowing your team to easily modify colors or isolate specific elements as needed. Additionally, I supply high-resolution transparent PNGs for quick integration into web mockups or presentations.
This method effectively transforms abstract tech offerings into something tangible and user-friendly, facilitating a better understanding of complex ideas and encouraging user interaction with your product.
€72.00
Icon & Vector Design

Icon & Vector Design
Icon & Vector Design
Icon & Vector Design
Icon & Vector Design
Icon & Vector Design

Icon & Vector Design
Icon & Vector Design
Icon & Vector Design

Icon & Vector Design
A well-defined brand identity simplifies intricate tech ideas, making them more relatable and memorable. Isometric vector illustrations effectively showcase SaaS features, offering a clear visual representation of technical elements that users can easily grasp. In the context of a SaaS dashboard, tailored isometric illustrations depicting items such as servers, data clouds, and analytics graphs can clarify complex data flows and operations.
You will receive a set of three distinct isometric scene illustrations, each featuring various interconnected objects. For instance, a visual representation of a data pipeline leading into a report can effectively demonstrate the relationship between data collection and storage. These illustrations are specifically designed to reflect your product’s interface or data flow, ensuring they are accurate and pertinent.
With considerable experience in producing materials for B2B software firms, I have observed that isometric illustrations significantly enhance the communication of capabilities, whether in onboarding guides, sales presentations, or product tutorials. The use of an isometric grid guarantees that all components maintain a consistent perspective and lighting, resulting in a polished and unified set rather than a haphazard assortment of images.
The files are provided as fully editable AI vectors, with each component organized on separate layers, allowing your team to easily modify colors or isolate specific elements as needed. Additionally, I supply high-resolution transparent PNGs for quick integration into web mockups or presentations.
This method effectively transforms abstract tech offerings into something tangible and user-friendly, facilitating a better understanding of complex ideas and encouraging user interaction with your product.